Please wait...
About This Project

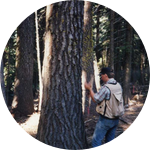
Biodiversity of plant species is thought by many to be essential to forest function and health. But what elements of forest structure are most important to species diversity? How do microclimate variables like temperature, evapotranspiration and photosynthetically active radiation interact? I'm a graduate student focused on developing spatio-temporal models that characterize forest structure and enable forest measurements to be analyzed to aid in forest policy making decisions.

Browse Other Projects on Experiment
Related Projects
Worms at Work: Scoping Natural Carbon Sequestration at Scale
For centuries, scientists noted earthworms' exploits as ecosystem engineers. Recent research shows the feasibility...
Whales as oceanographers: Developing multi-sensor tags for improved understanding and management of critical habitats
Limited oceanographic data prevent accurate prediction of whale foraging hotspots. To address this, we will...
Communities perception and monitoring of ocean acidification in the Douala-Edea national park (Cameroon)
This project will help us to evaluate the vulnerability of clam fishing to ocean acidification (OA) in the...