Making Some Noise, Making a Difference
Exciting news! The first paper is in the pipeline!
This project represents a strong collaboration of SANParks, Cape Nature, and Stellenbosch University to make a difference in the South African government's approach to managing invasive species. Over the last nine months I've been analyzing data on invasive plants in the protected areas (e.g., national parks) of the Cape Floristic Region (their distribution, density, etc.).
Given the current distribution of invasive plants in the protected areas, and the costs of managing these species in the Working for Water program, we estimated how much and how long it would cost to clear all the alien plants from these areas. As it turns out, invasive plant control would be feasible within 20 years....if some very strong assumptions are made! We make some strong recommendations to improve the efficiency of invasive alien plant control in protected areas- the last stronghold of biodiversity. This paper has exceptional importance for conserving the diverse plants and animals of fynbos. Stay tuned, you will be updated!
As an exciting development, we've been invited to do a similar analysis for Kruger National Park in the east of the country, where the savanna vegetation is plagued by a different suite of invasive plants than in fynbos. The park management staff are extremely eager to see this project through as it will help them manage invasive aliens and conserve native fauna (and megafauna!) in yet another extremely important protected area, this time in the savanna biome.
Sunset in Kruger National Park, where we met park staff to discuss a new research project
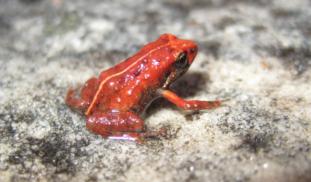
Unfortunately South Africa is experiencing an extensive drought. While we were in Kruger National Park to discuss this project, Brian noted that some of the waterholes and dams that had always been filled with water--- always- --were bone dry. I guess we'll see what this means for the little frogs when the second round of sound recordings begins in a few months.
In the meantime I have been familiarizing myself with the analysis process:
1) start with a soundbite of frog calls...
2) end up with an estimate of how many frogs are calling.
It's an interesting process of first, "telling" the software what, in all that noise, is a frog call. What characteristics does it have? How long is a frog call (milliseconds)? What is the peak frequency of the call? It's an intricate game of getting the software to spot frog calls and not bird calls, for example.
Each call is recorded in a database, including the microphones on which it was received, how loud it was, and at what time it was received. Then I take that database of information and feed it into R (analysis software) along with many other parameters and information (like the gps locations of the microphones, how many times a frog calls per minute). Voila, the end result is an estimate of frogs per hectare.
One of the cool outputs is a "map" of frog call locations. For example:

The red x's are the microphone locations, and the blue dots are frog call locations. The grey area is the boundary within which I could hear frogs calling.
Think that's cool? ......Good!! More science is on the way....
4 comments