Please wait...
About This Project
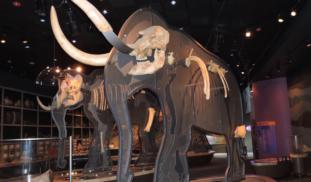
American mastodons lived all across North America during the Ice Age. Paleontologists long suspected that western mastodons differed in subtle ways from eastern ones, and our initial data suggest they may have been distinctive in size and tooth proportions. We plan to examine various museum collections to build a robust database of mastodon measurements, allowing us to document regional population differences and helping us understand ecosystem variation and animal dispersal during the Ice Age.
More Lab Notes From This Project

Browse Other Projects on Experiment
Related Projects
The End of an Era: Resolving the dinosaur extinction and the beginning of the "Age of Mammals" in Northwest Argentina
The extinction of non-avian dinosaurs 66 million years ago paved the way for the "Age of Mammals", but the...
Tooth plates in chimaeras and their relationship to teeth in sharks
The chimaeras (ghost sharks and spookfish) are a group of often deep sea fishes related to the sharks and...
Mastodons of Unusual Size: Exploring variation in American mastodon populations
American mastodons lived all across North America during the Ice Age. Paleontologists long suspected that...


