Initial Look at Wave Spectral Analysis Processing Techniques
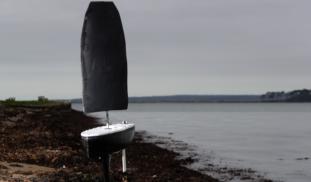
Sea wave monitoring is vital for weather forecasting and climate modelling and can heavily impact shipping routes, marine engineering and many more industries. For this project we will be deriving wave spectra from an autonomous sailboat. Sea wave monitoring is typically done by floating or moored buoys that interact directly with sea waves as compared to a sailboat which is influenced by wind and current.

To derive wave spectra data from a small autonomous sailboat we have implemented two methods with the aim to compare this data to a Spotter Buoy for validation:
Using GPS Z elevation data
Using accelerometer data from the IMU
This can be further split into two subsections:
Processing the raw data
Deriving wave spectra and wave parameters
Steps to processing GPS data
Removal of any GPS errors and any outliers in the displacement data.
Linear detrending - GPS noise and errors cause drift in the raw data so it is necessary to correct these unwanted trends.
Applying a filter to remove any additional GPS errors.
The figures below show the difference between pre and post processing the raw GPS data, with data taken from our 50 hour Falmouth trial.


Steps to processing IMU data
Aligning the Z accelerometer to the Earth orientated Z axis using pitch and roll data.
Double integrating the acceleration data will produce the Z displacement data.
Applying a filter between integration to correct any errors present in the accelerometer data.
The figures below show the raw Z acceleration data and the derived displacement, with data taken from our 50 hour Falmouth trial.


From reviewing both IMU and GPS data it is clear that there are errors still present in the post processed data. GPS data still contains outliers and IMU data is clearly influenced by direction of the waves interacting with the boat as can be seen at roughly 1300 seconds when the displacement data increases due to a change in the vessels heading. Both these issues may be due to a number of reasons:
The processing techniques adopted above are similar to what is used on floating and moored buoys which interact directly with the waves whereas a sailboat behaves differently in open bodies of water due to wind and current which influences its movement and therefore sensor readings. It would be necessary to explore new processing techniques that are associated with a sailboats movement.
The IMU sensor in particular is positioned to the front of the boat, this may cause for an increased amount of noise in the data. Adjusting the position of the IMU such as moving it towards its centre of gravity will reduce the influence of wave direction on its sensor readings.
Wave Spectra
The wave parameters that we are currently concentrating on recreating are significant wave height and wave period.
To determine wave parameters from processed sensor data, the most intuitive way would be to use the time series from its processed displacement data and determining individual wave heights and periods but wave spectra is actually most commonly derived from a power spectral density (PSD).
Significant wave height is computed by multiplying the root of the wave elevation variance (or zero moment) by four. The definition of significant wave height in the time domain is the average height of the highest one thirds of recorded waves.

Where the nth moment can be calculated using the non directional wave spectrum E(f) and its corresponding frequency f

The peak period is easily computed by taking the inverse of the peak frequency

And the mean period can be computed from the zero moment and first moment which can be derived from the non directional wave spectra

Validation Data
Thanks to the support of our project from our sponsors we have purchased a Spotter Buoy to validate our data. The Spotter Buoy uses a GPS module to derive directional and non directional wave spectra and from this many different wave parameters can be computed. Using raw Z elevation data taken from the Spotter Buoy a power spectral density is computed and wave parameters can then be derived. The Spotter Buoy computes a variety of different wave parameters which we would also like to integrate into our autonomous sailboat such as significant wave height and wave period.

Next Steps
Continue to develop processing techniques for both GPS and IMU data:
GPS data clearly has an increased amount of error and noise when compared to the IMU data. It would be beneficial to experiment with different filters and positioning of both sensors within the vessel. Investing in a more reliable GPS sensor may also be beneficial to ensure the data can be used to produce accurate wave spectral data.
IMU data has much less noise but it can be seen that the data is heavily influenced with how the vessel interacts with the current and the wind. For future testing it would be beneficial to test the effect of shifting the sensor closer to the vessels centre of gravity which may reduce the effect wave direction has on IMU readings.
Currently we have only collected limited data from the Spotter Buoy, in future sea trials it would be beneficial to collect a larger dataset from the buoy to be able to accurately recreate wave spectral data from our very own micro-vessel.
Thank you to all the support for this project! We will be following up this lab note in the future with more regular updates on developing wave spectra data from our micro-vessel.
0 comments