Please wait...
About This Project
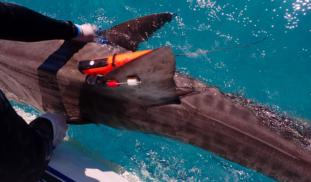
Tiger sharks are among the strangest behaving sharks in our oceans. They eat everything from turtles to car tires and continually dive up and down. However, we know next to nothing about their hunting and movement strategies. Characterizing these are important to effectively manage tiger shark populations and understand ecosystem dynamics. This project will tag up to 30 tiger sharks at Ningaloo Reef, recording video, depth and acceleration to better understand these patterns.
More Lab Notes From This Project

Browse Other Projects on Experiment
Related Projects
Out for blood: Hemoparasites in white-tailed deer from the Shenandoah Valley in Northern Virginia
Our research question centers about the prevalence and diversity of hemoparasites that infect ungulate poplulations...
Using eDNA to examine protected California species in streams at Hastings Reserve
Hastings Reserve is home to three streams that provide critical habitat for sensitive native species. Through...
How do polar bears stay healthy on the world's worst diet?
Polar bears survive almost entirely on seal fat. Yet unlike humans who eat high-fat diets, polar bears never...


